Creating a Chart.js Component in Alpine.js and Livewire: A Step-by-Step Guide
In this tutorial, we will learn how to create a Chart.js component in Alpine.js, a lightweight JavaScript framework that allows you to bind dynamic data to HTML templates. We will use the code provided above as a starting point, Let's take a closer look at the different components and how they work together.
- The x-data attribute:
The x-data attribute is used to define the initial state of an Alpine component. In this case, we have defined a property called chart which is set to null. This will be used to store the Chart.js object that we will create later.
- The x-init attribute:
The x-init attribute is used to execute JavaScript code when the component is initialized. This is where we will create the Chart.js object and configure it with the desired options.
- The canvas element:
The canvas element is used to render the chart. We have given it an id of "myChart" so that we can easily reference it in our JavaScript code.
- The Chart.js library:
Finally, we need to include the Chart.js library in our HTML file. This can be done by adding a script element that points to the Chart.js CDN.
Now that we have an overview of the different components, let's see how they work together to create a Chart.js component in Alpine.js.
Step 1:
First, we need to define the x-data attribute for our component. As mentioned earlier, this is where we will define the initial state of our component, which in this case is a property called chart set to null.
<div x-data="{ chart: null }"> ... </div>Step 2:
Next, we will use the x-init attribute to execute some JavaScript code when the component is initialized. This is where we will create the Chart.js object and configure it with the desired options.
<div x-data="{ chart: null }" x-init=" chart = new Chart(document.getElementById('myChart').getContext('2d'), { type: 'line', data: { labels: ['January', 'February', 'March', 'April', 'May', 'June', 'July'],//$wire.labels datasets: [{ label: 'My First Dataset', data: [65, 59, 80, 81, 56, 55, 40],//$wire.sourceOfData backgroundColor: 'rgba(255, 99, 132, 0.2)', borderColor: 'rgba(255, 99, 132, 1)', borderWidth: 1 }] }, options: {} }); "> ... </div>In this code, we are using the Chart constructor function provided by the Chart.js library to create a new chart. We pass in the canvas element's 2D rendering context as the first argument, and an object containing the chart configuration options as the second argument.
Step 3:
Next, we will add the canvas element to our component. This is where the chart will be rendered.
<div x-data="{ chart: null }" x-init="
  chart = new Chart(document.getElementById('myChart').getContext('2d'), {
    type: 'line',
    data: {
      labels: ['January', 'February', 'March', 'April', 'May', 'June', 'July'],
      datasets: [{
        label: 'My First Dataset',
        data: [65, 59, 80, 81, 56, 55, 40],
        backgroundColor: 'rgba(255, 99, 132, 0.2)',
        borderColor: 'rgba(255, 99, 132, 1)',
        borderWidth: 1
      }]
    },
    options: {}
  });
">
  <h1>Dashboard</h1>
  <hr>
  <canvas id="myChart" width="400" height="400"></canvas>
</div>
Step 4:
Finally, we need to include the Chart.js library in our HTML file . For the sake of this post, we will implement it by adding a script element that points to the Chart.js CDN.
<script src="https://cdn.jsdelivr.net/npm/chart.js@2.9.3/dist/Chart.min.js"></script>
If we refresh the page now we should be able to see something like this

To implement the same thing and get the data from a livewire component, we can do the following:
- Create a livewire component.
- Define properties to entangle with alpine.js
- Copy and paste the above snippet into the component's view file.
Let us create a new livewire component.
php artisan make:livewire LivewireComponent
Then update the component class with:
<?php

use Livewire\Component;

class LivewireComponent extends Component
{
    public $name = 'Revenue by month with Livewire';

    public $labels = ['January', 'February', 'March', 'April', 'May', 'June', 'July'];

    public $dataPoint = [65, 59, 80, 81, 56, 55, 40];

    public function render()
    {
        return view('livewire-component');
    }
}
Note that the above are dummy data. To get data from database, you have to make the changes on query for your specific needs.
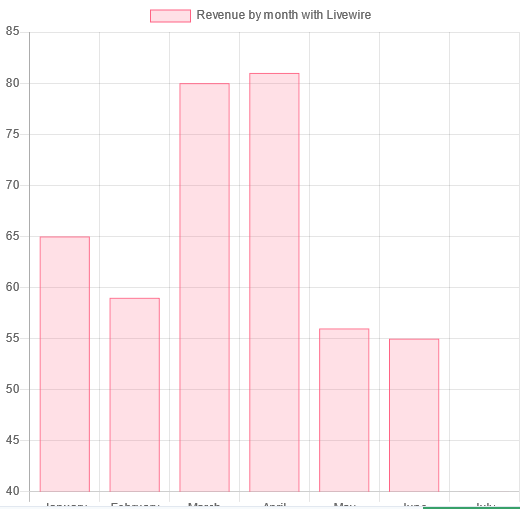
Once done, we have to update replace the labels and datasets Let's do it now.
<div x-data="{ chart: null }" x-init="
    chart = new Chart(document.getElementById('myChart').getContext('2d'), {
      type: 'line',
      data: {
        labels: $wire.labels,
        datasets: [{
          label: $wire.name,
          data: $wire.dataPoint,
          backgroundColor: 'rgba(255, 99, 132, 0.2)',
          borderColor: 'rgba(255, 99, 132, 1)',
          borderWidth: 1
        }]
      },
      options: {}
    });
  ">
    <canvas id="myChart" width="400" height="400"></canvas>
  </div>
Output:

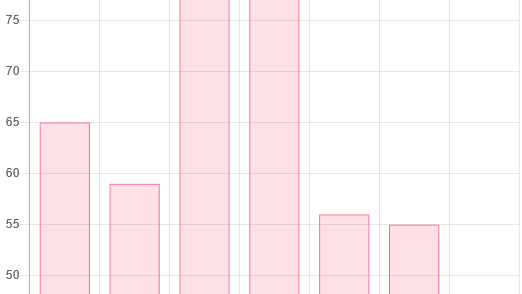
We can also change the type of chart we want. SImply change the value
type: 'line'
to
type:'bar'
or
type: 'pie'
We should then be able to display a pie or a bar chart.
And that's it! You now have a Chart.js component in Alpine.js and/or Livewire that displays a line/bar/pie chart. You can customize the chart further by modifying the configuration options passed to the Chart constructor function. For more information on the different options available, you can refer to the Chart.js documentation.
Test it on Laravel Playground !
Related PostsView all posts

Imagine you're on a website, and you want to show... Read more
Rezaul H Reza,16 August 2023

In this tutorial, we'll walk you through the steps... Read more
Rezaul H Reza,29 December 2022
Comments (1)
xxx
1 year ago
asdad
Leave a Reply
sdfdsf
1 year ago
xsss